An open peer review of a preprint paper by Hatch A et al. from Viome, posted on OSF Preprints, January 2019.
Full disclosure: I worked for Viome’s competitor uBiome from October 2016 – December 2018. I am currently an independent consultant.
Andrew Hatch, James Horne, Ryan Toma, Brittany L. Twibell, Kalie M. Somerville, Benjamin Pelle, Kinga P. Canfield, Guruduth Banavar, Ally Perlina, Helen Messier, Niels Klitgord and Momchilo Vuyisich*
Viome, Inc, Los Alamos, NM 87544, United States.
Background information
In a recent paper authored by Stanford researchers, biotech startups were criticized for not sharing their discoveries through peer-reviewed research studies. So in that light, it is great to see a biotech company such as Viome publish a study about their microbiome consumer product. Viome’s leaders have been very vocal about the superiority of their product – which is based on RNA transcription – over that of other microbiome consumer tests, which are based on DNA amplification and sequencing. But until this preprint came out, no research on the Viome product had been published. So I was excited to hear about this preprint!
It is important to first point out that this paper is not a peer-reviewed paper. It is a preprint, which means it is written as an academic paper, but it has not been peer-reviewed by other scientists. It is a first step, however, to share the work that Viome did to build a metatranscriptomics platform, and show some of their first results. I hope my comments will be useful in the process of getting this study published in a peer-reviewed journal.
The paper describes Viomega, Viome’s automated stool metatranscriptomics method that involves RNA extraction from stool samples, sequencing, and bioinformatics analysis. Let’s go over each of the sections.
 Introduction
The introduction of the paper is mostly stating how metatranscriptomics is superior to other techniques. It has a somewhat oversimplified table showing other methods (bad!) to their own method (good!).
For example, under “Method Biases”, the 16S Gene Sequencing column states “Heavily influenced by amplification method, but also sequencing quality, sample lysis, and bioinformatics“, where “heavily influenced” sounds a bit denigrating, while sequencing quality and bioinformatics are conveniently left out in the Metatranscriptomics column.
The “identifies all living organisms” appears oversimplified as well. First, is a phage or virus alive? Then, how about a bacterium that is in a viable-non-culturable or spore-state? It is alive, but it is probably not transcribing much RNA – can metatranscriptomics detect those?
The statement that Metatranscriptomics “allows assessment of pathway activities that can lead to personalized health insights and recommendations with molecular-level precision” is overly subjective and is not proven in this paper. That last part of the sentence sounds like a Viome commercial, not like something that belongs in a scientific paper.
The introduction text states that 16S gene sequencing misses archaea or eukaryotes, but fails to acknowledge that most of these can be identified with broad-range primers as well.
In short, the Introduction shows a too black- and white comparison between different microbial community methods that is not very objective.
Methods
Not unexpectedly from a biotech company, the paper does not provide a lot of technical details on sample extraction, library preparation, or bioinformatics analysis. In order to pass peer review, the authors will likely need to provide more details on their methods – so that others can easily replicated them. The statements about participant consent and IRB approval were also very short; most journals and peer reviewers would like to see something more than “all study procedures were approved by an IRB” from a non-academic institution.
Results: Validation and reproducibility
The first part of the Results shows that the Viomega method can detect a range of different microorganisms with relative equal efficiency and precision. Using mock communities, the results are accurate, and reported to contain no false positives or negatives or sample-to-sample crosstalk. However, data given here were very sparse.
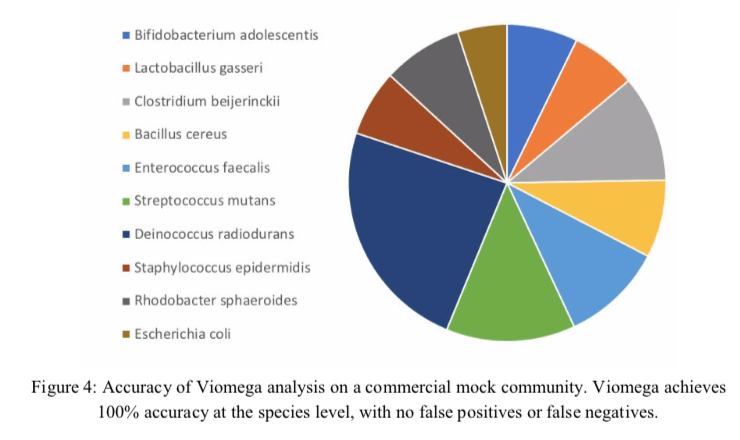
Figure 4 is a colorful representation of the mock community sequencing experiment, but is lacking percentages and other details, such as number of reads. Where there really no false positive or false negative reads? Not a single one? There is also no word on how the negative controls did perform over their tests of 10,000 samples. It would have been really valuable to have compared this mock community using all three methods compared in Table 1; 16S, metagenomics, and metatranscriptomics.
This section of the Results also shows that the Viome test is reproducible. Three different experiments were performed in which small numbers of participants (3 to 7 persons) collected stool samples testing the following:
- stool collection from different part of their stool sample (Figure 5)
- waiting 0, 3, or 10 min before adding stool to the kit tube (Figure 6)
- collecting stool on 3 different days over a period of two week (Figure 7)
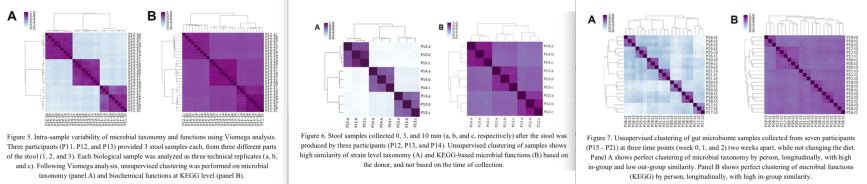
In all three experiments, samples from the same stool specimen or individual were very similar to each other, showing that the Viome test results are reproducible (the dark squares along the diagonal in Figures 5, 6, 7).
Is Gene Function Composition better than simple Taxonomy?
Figures 5/6/7 show the test results in two different ways. The A panels in each figure are based on which active microbes are present in the samples, so based on the taxonomy of the RNA reads. The B panels are the results based on gene function composition (which genes are being expressed in that sample).
It was interesting to see that in all cases the microbial composition (taxonomy; A panels) was better able to tell individuals apart than the gene expression (B panels).
Detailed explanation: If you look at the A panels, the comparison of each person to other samples from the same person shows they are very similar (purple) while each individual is very different (light blue) from other persons. In the B panels, the individuals do not differ that much from each other; all individual-to-individual comparisons are darker shades of purple that are more difficult to tell apart.
That is a bit ironical, because the preprint states at the beginning (Abstract and Table 1) that functional gene analysis, not microbial composition based on taxonomy, is needed for personalized health insights. Instead, the paper appears to show that each person has their own, personal gut microbiome, while the functional capacities appear to be pretty similar between individuals.
The paper does not provide an answer how these small person-to-person variations in microbial gene expression will lead to the “goal to develop personalized nutrition algorithms” as stated in the Abstract.
Transcriptomics taxonomy prevalence data from 10,000 samples
Metatranscriptomics is superior to other techniques, stated the paper in the Introduction and Table 1, but the paper does not do anything to prove that. There was no comparison of 16S sequencing vs metatranscriptomics on e.g., the mock community shown in Figure 4. Such a comparison could add a lot of value to the paper, and could support the bold statements made in the Introduction.
Also, the amount of viruses, archaea, and eukaryotes in the sample set was not very high, suggesting that 16S sequencing does not miss as much diversity as the authors claim in the introduction. For example, strain level analysis (Table S1) shows crAssphage as the most prevalent virus, but it is ranked #144 of all taxa (26%). Similarly, Methanobrevibacter clocks at #269 (14%), while Entamoeba is the most prevalent eukaryote at #336 (10% of samples).
Many of the viruses/phages found in the stool samples appear to be plant associated (Suppl tables). For example, Phaseolus vulgaris endornavirus (beans), Pepper mild mottle virus, Cannabis cryptic virus, and shallot latent virus are among the most prevalent viruses. Could the authors comment on this? Could these be transient microbiome components that were part of a food item, or are they present in the same person over longer periods of time? It would be nice to see some data on that.
Several taxa appear to behave very differently on strain/species/genus level (Tables S1-S3). Examples where genus-level prevalence is much lower than expected based on strain prevalence are given below. In other examples, taxa with high prevalence at genus level seem to disappear at species or strain level; also given below.
Unfortunately, relative abundance data appears to be missing. How abundant are viruses, archaea and eukaryotes ? Which percentage of the transcriptomics reads were assigned to each of these groups? These numbers, now missing, would tell us which groups 16S sequencing would miss and would allow for a better comparison of different microbial community analysis tools.
Can Viome’s microbiome analysis connect the diet and the gut metatranscriptome?
The paper contained very few functional results on the data from 10,000 Viome samples. Viome has repeatedly claimed that transcriptomics are much more informative than just lists of microbial taxa, and the abstract promises “several small clinical studies to demonstrate the connections between diet and the gut metatranscriptome.”
Therefore, it was disappointing to see that the paper was mainly limited to taxonomic assignments. This dataset, which is one of the largest of its kind, sounded very promising, and I had hoped to see many more functional analyses on these samples.
Table 4 is the only part of the study that analyzes the functional capacity of the data from 10,000 samples. It lists the top 12 KEGG functions (although the legend says “top 10”; see below). Unfortunately, this table is not very informative and might contain some errors (see below). Most importantly, it is just a list of genes without any discussion on their function.
In addition, if the prevalence of these genes is over 99.9% (meaning that almost every person’s microbiome contains those genes), how can one use that for the correlation of microbial taxa or genes with lifestyle or diet? Based on the top 10 or top 100 (Table S4) KEGG functions, all subjects’ microbiomes appear to have the exact same genes. How is this functional data superior to the big inter-individual differences that are found by the more conventional 16S types of microbiome analyses? The paper would be much stronger if this important point would be discussed.
Summary of findings
In summary, the strengths of this paper are the experiments showing that the Viomega technique is reproducible. That is a great paper by itself, but the current title and abstract are promising much more than the paper currently delivers. With a transcriptomics dataset of 10,000 stool samples, and repeated claims that transcriptomics will give much more functional insight than just a list of taxa, it is disappointing to see that the results are limited to microbial taxon prevalence and not any functional analysis.
Based on this paper, Viome’s claims that their test can connect the microbiome transcriptome to a subject’s diet – let alone give dietary advice – appear to be very far-fetched.
Specific / detailed comments
- Introduction: Reference 1, Nasca 2018, does not appear to be about the microbiome but about Acetyl-L-carnitine deficiency in people with depression
- “16S gene” should be “16S rRNA gene”, at least the first mention in the manuscript
- Not all 16S sequencing uses a short piece, in several cases one can identify to species level, depending on length of gene fragment used
- “In addition, it misses some bacteria, most archaea, and all eukaryotic organisms and viruses [19].” Actually, reference 19 shows that great archaeal diversity can be captured using archeaon specific 16S primers (which is still 16S sequencing) – as long as you use different primers. Also this reference does not support the statement that 16S sequencing misses eukaryotic organisms and viruses.
- Table 1 is not very objective (see above). The last 2 rows appear to say the same thing; statement in the right/bottom cell is too strong. Top right cell: only if metabolically active.
- Results: the first section (“Validation…”) might be better moved to the Methods.
- Figure 1. It is not quite clear what the input here was. The RNA yield is given, but how were the input amounts relative to each other? Were equal number of cells added, or equal amount of turbidity? Were samples normalized for e.g. genome size?
- “Ambient sample transportation”: The statement “There has been unfounded criticism of metatranscriptomics ” does not appear to be very scientific, and it lacks a reference.
- Figure 2: It is not clear which of the peaks shows the RNA. The peaks in B are much lower; it would be better to show both panels at the same Y-axis scale. Also, if these are two “representative” samples, did they contain the same original sample?
- Page 6: “Viomega eliminates STSC altogether” is not true – while it is low, it is not 0, as shown in Figure 3, so this needs to be reworded.
- Figure 3: “Cross talk” is a very technical term – the figure legend should define how this is measured (text in Results was more helpful).
- Page 7: “more than 1,000 fold lower ” – this data is not shown – either provide a reference or do the experiment.
- Page 7, “Background contamination”. “Since any metagenomic or metatranscriptomic analysis identifies all taxa in a sample” is only true for live, transcribing organisms.
- This section also states that background contamination would be picked up by the PPC sample (positive control) but is much more likely to be detected by the negative control sample. However, the study does not show how many reads were detected in the NC samples. Could the authors add that data? The Salter paper clearly shows that background taxa are rarely detected in samples with high amount of “real” taxa – they only show up when there is very low amount of real nucleic acid to detect.
- What is Table 2 showing? Number of contaminating reads in PPC samples? More detail is needed here. How can these 1.4 reads per sample be distinguished from the “Sample to Sample Cross Talk” reads? Both Figure 3 as well as Table 2 appear to be studying the same thing, that is the number of reads that were assigned to different taxa than included in the PPC mixture. Could the authors clarify the difference?
- “Findings from the Viomega taxonomic classification”. The main text says that Tables S1-S3 include the top 100 taxa, but this appears incorrect. E.g., S1 lists 2723 taxa (strain level), so there are many more taxa than 100.
- Table 4
- The table lists 12 KEGGS, so it is not a top 10 as mentioned in the text
- The top 10 KEGGS (table 4) and the top listings in Table S4 do not match. K00540 (#5 in Table S4) K03296 (#7) and K06950 (#10) are not present in Table 4. In contrast, K03737 (#3 in table 4), K00975 (#8), K00705 (#9) are not present in the top 10 in Table S4.
- Tables 4/S4: a short description of what these functions entail would be welcome.
- KEGG K00936 appears to be a two-component system, sensor histidine kinase PdtaS [EC:2.7.13.3] – not E2.7.3.-[EC:2.7.3.-] as denoted.
- Page 11. Subject 11’s stool appears to show some clustering per stool section (1/2/3). “Biological replicates were indistinguishable from the technical replicates.” might therefore be incorrect; some statistical analysis is needed (.e.g Lin’s correlation) to see which factor (technical vs biological replicate vs subject) is the strongest.
- Page 11. “While there have been claims of large intra-sample variability” – this refers to a paper (#34) that tested samples from different persons and different anatomical sites which – not surprisingly – were found to vary. However, in the current study, the authors tests biological and technical replicates, something that was not tested in Reference 34.
- Tables S1-S3: Several taxa appear to behave very differently on strain/species/genus level.
Examples where genus-level prevalence is much lower than expected based on strain prevalence:
Eggerthella
Strain: Eggerthella lenta 1_1_60AFAA, at 97.08% prevalence
Species: Eggerthella lenta at 91.76%
Genus: Eggerthella at 61.12%
Veillonella
Strain: Veillonella dispar A at 92.34
Species: Veillonella dispar at 88.99%
Genus: Veillonella at 78.62%
Entamoeba:
Strain: Entamoeba nuttalli P19 at 9.85% / Entamoeba dispar SAW760 0.74%
Species: Entamoeba nuttalli: 9.87% / Entamoeba dispar 0.74%
Genus: Entamoeba: 0.79%
In other examples, taxa with high prevalence at genus level seem to disappear at species or strain level:
Lactococcus
Strain: Lactococcus piscium MKFS47 at 0.99% / Lactococcus raffinolactis NBRC 100932 at 0.23%
Species: Lactococcus piscium at 0.98%
Genus: Lactococcus at 96.88%
Escherichia
Strain level: Escherichia coli isolate 15 at 37.8%; Escherichia coli strain LS5218 at 9.5%, Escherichia coli M17 at 7.7%.
Species level: Escherichia coli at 27.40%
Genus level: Escherichia: 85.92% prevalence
Saccharomyces
Strain: Saccharomyces sp. ‘boulardii’ strain unique28 is present at 1.82% of samples, as the most prevalent Saccharomyces strain. Also Saccharomyces cerevisiae S288C at 0.80%.
Species level: S. cerevisiae is present in 3.9% of samples.
Genus level: Saccharomyces it is present in 25.44%.
Streptococcus
Strain: Streptococcus sp. 263_SSPC 5.56% / Streptococcus mutans U138 at 1.62%
Species: Streptococcus thermophilus 28.15% / Streptococcus mutans 9.92% / Streptococcus parasanguinis 7.54%
Genus: Streptococcus 90.47%
Salmonella
Strain: Salmonella enterica subsp. enterica strain SE696A 2.30%; Salmonella enterica subsp. enterica strain ADRDL-LA-5-2013 2.28% / Salmonella enterica subsp. enterica serovar Typhimurium strain 1.52%
Species: Salmonella enterica 11.71%
Genus: Salmonella 15.61%

Thank you very much for this write up. It’s very useful.
LikeLiked by 1 person
Thank you for this great read.
LikeLike